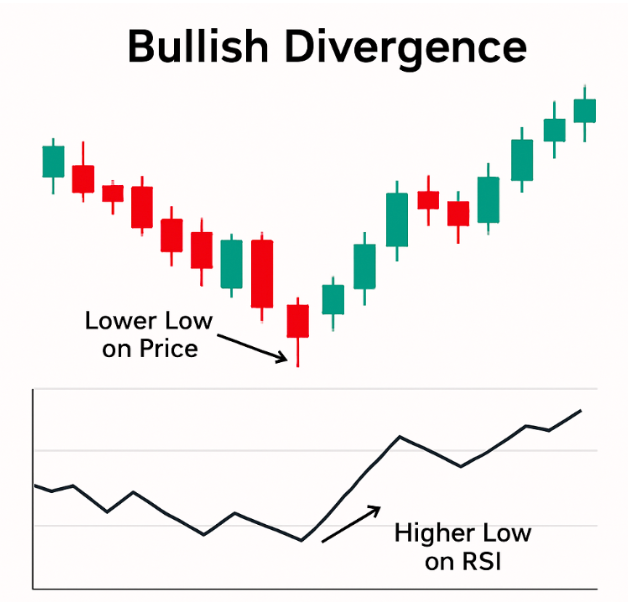
If you’ve ever found yourself staring at a price chart, wondering when the next move is coming, you’ve likely encountered bullish divergence without even realizing it. Bullish divergence is one of those subtle but incredibly powerful indicators that often signals a shift in momentum before the price tells the full story.
In this post, we’ll break down what bullish divergence is, how to spot it, how to use tools like the RSI and MACD, and how it ties into other familiar trading concepts—like candlestick patterns. Whether you’re a beginner or seasoned trader, this is your complete guide to understanding bullish divergence.
What Is Bullish Divergence?
Bullish divergence occurs when the price of an asset forms lower lows, while a technical indicator like the RSI or MACD forms higher lows. This discrepancy suggests that bearish momentum is weakening, even though the price may not reflect that change yet. It’s like the market is quietly building strength beneath the surface.
This concept is closely related to other divergence types like hidden bullish divergence, which we’ll explore later. But at its core, bullish divergence tells you one thing: the downtrend might be losing steam.
Spotting Bullish Divergence With RSI and MACD
RSI Bullish Divergence
The RSI (Relative Strength Index) is a favorite among traders for identifying overbought and oversold conditions. When you spot a bullish RSI divergence—lower price lows but higher RSI lows—it can be a strong signal that a reversal is on the horizon. This setup becomes especially reliable when RSI dips below 30 (indicating oversold territory) and then forms a higher low while the price falls further.
MACD Bullish Divergence
The MACD (Moving Average Convergence Divergence) also shines when identifying divergence. A bullish divergence MACD setup occurs when the price makes new lows, but the MACD histogram or MACD line forms higher lows. Like the RSI, this shows the bears are losing strength.
Both indicators can be powerful on their own, but combining them strengthens the case for a potential move higher.
The Difference Between Bullish Divergence and Hidden Bullish Divergence
What Is Hidden Bullish Divergence?
Unlike regular divergence, hidden bullish divergence appears when the price forms higher lows, but the indicator shows lower lows. It may sound contradictory, but this type of divergence suggests continuation of the uptrend, rather than a reversal.
Think of it this way: regular bullish divergence hints at a trend reversal, while bullish hidden divergence signals that the current trend is taking a breather before continuing. Both are valuable, but they serve different strategic purposes.
Real-Life Example of Bullish Divergence in Action
Let’s say a stock falls from $100 to $80, rebounds slightly, then drops to $75—but the RSI forms a higher low during this second drop. That’s a classic RSI bullish divergence signal. It’s as if the market is showing internal strength even though the price hasn’t caught up yet. Savvy traders who noticed this might enter early and catch the move back to $100.
These moments are often complemented by candlestick patterns—like hammers or bullish engulfing candles—confirming that the bulls are regaining control.
How to Trade Bullish Divergence Confidently
- Use multiple indicators: Don’t rely solely on RSI or MACD—look for confluence with volume, candlesticks, or support levels.
- Zoom out for context: Make sure you’re looking at a meaningful timeframe. One-hour charts may show noise, while daily charts provide clarity.
- Set stop losses: Divergence isn’t foolproof. Use smart risk management to protect your capital.
- Confirm with candlestick signals: Patterns like dojis, hammers, and morning stars can validate a bullish divergence RSI signal.
Bullish Divergence vs Bearish Divergence
While bullish divergence suggests potential upward movement, bearish divergence is its mirror image—higher highs in price paired with lower highs in indicators, signaling a possible downtrend. Knowing how to spot both gives you a tactical edge in all market conditions.
Limitations of Bullish Divergence
Not every divergence leads to a reversal. Sometimes the price continues in its trend despite the indicator’s message. That’s why confirmation is key. Always look for additional signals and ensure that your strategy isn’t built on divergence alone.
Final Thoughts: Is Bullish Divergence Worth Watching?
Absolutely. Bullish divergence is a must-know tool in any trader’s toolkit. From identifying bottoms before the bounce to spotting hidden continuation signals, this pattern has proven itself across countless charts and timeframes.
If you’re already using candlestick analysis, adding divergence to your repertoire can add another layer of precision to your trades. Especially in volatile markets, catching early signs of a shift can make all the difference.
So the next time you’re scanning charts, remember: price may lie, but divergence often whispers the truth.
Bullish divergence can turn missed opportunities into profitable trades. Master it, and you’re one step closer to reading the market like a pro.


