In the dynamic world of trading, the doji candlestick stands out as a vital signal every trader should understand. It might look simple at first glance, but the implications of this humble pattern are profound. Whether you’re a beginner wondering “what is a doji candlestick?” or an experienced trader refining your candlestick analysis, mastering this pattern can elevate your trading strategy.
What is a Doji Candlestick?
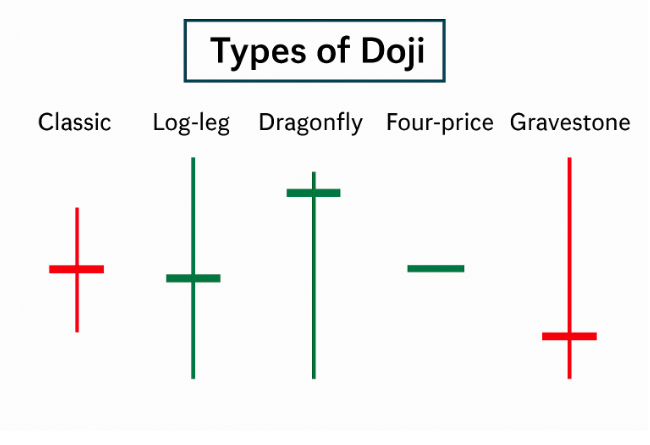
A doji candlestick forms when a security’s opening and closing prices are virtually equal. This results in a small or non-existent body with long upper and/or lower wicks. In essence, it represents indecision in the market—a tug of war between buyers and sellers with no clear winner.
The appearance of a doji on a chart is like the market pausing to catch its breath. Traders often interpret this as a potential turning point, but the real value comes from understanding the doji candlestick pattern in context.
Key Types of Doji Candlesticks
1. Dragonfly Doji Candlestick
The dragonfly doji candlestick has a long lower shadow and no upper shadow. It suggests that sellers initially dominated the session, but buyers stepped in to push prices back to the opening level. This can signal a potential bullish reversal, especially when it appears after a downtrend.

2. Gravestone Doji Candlestick
In contrast, the gravestone doji candlestick features a long upper shadow with little to no lower wick. This pattern indicates that buyers drove prices up during the session, but sellers regained control by the close—a potential sign of bearish reversal if it appears after an uptrend.

3. Standard Doji (Neutral)
This version of the candlestick doji has both upper and lower shadows of roughly equal length. It reflects complete market uncertainty, often appearing during periods of consolidation or before a significant move.

How to Use Doji Candlestick Analysis in Trading
Understanding the doji candlestick chart and its context is crucial. Here’s how traders use it:
Combine with Other Indicators
A doji on its own isn’t always actionable. However, when combined with volume spikes, support/resistance zones, or trendlines, it becomes far more telling. For instance, a doji dragonfly candlestick at a key support level can be a compelling buy signal.
Look for Confirmation
Wait for the next candlestick to confirm the direction. For example, if a gravestone doji candlestick appears at the top of an uptrend, a strong bearish candle afterward provides confirmation of a reversal.
Timeframe Matters
On higher timeframes (like daily or weekly charts), a doji holds more weight than on lower ones. It’s vital to consider the pattern’s timeframe in your analysis.
Real-Life Trading Example: The Power of Indecision
In 2022, during a period of extreme volatility in tech stocks, a doji candlestick formed on the daily chart of Tesla just as it approached a key resistance level. Traders who recognized the market hesitation and combined it with RSI divergence were able to short at the top before a significant correction.
This real-world scenario highlights the importance of pairing candlestick patterns with broader market analysis.
Insights from Trading Experts About Doji Candles
According to Steve Nison, the author who introduced Japanese candlestick patterns to Western traders: “A doji represents the market at a crossroads. Understanding what led to the indecision helps traders act, not react.”
Nison emphasizes not just spotting the doji candlestick pattern, but interpreting its narrative within market context.
Common Misinterpretations About the Doji Candlestick Pattern
Over-reliance on Single Candlesticks
Relying solely on a doji to make trading decisions is risky. Use it as a signal to investigate further, not as a standalone reason to enter a trade.
Ignoring Market Context
A candlestick doji in a ranging market might just be noise. But the same pattern after a strong rally could signal exhaustion. Always evaluate the surrounding price action.
Misidentifying the Pattern
Not every small-bodied candle is a doji. Precise identification requires the open and close to be nearly identical. Using reliable charting tools helps avoid confusion.
Doji Candlestick vs. Hammer Candlestick
While the doji candlestick indicates indecision, a hammer (covered in our previous post) signals a potential bullish reversal. Both can suggest turning points, but their body shapes and market messages differ. Understanding the nuance between these patterns sharpens your overall analysis.
Final Thoughts: Why the Doji Deserves Your Attention
The doji candlestick might appear unassuming, but its implications are far-reaching. It signals a moment of market reflection—a pause before potential action. When used in conjunction with other tools, it becomes a powerful ally in your trading strategy.
Whether you’re analyzing a doji candlestick chart, spotting a dragonfly doji candlestick at support, or interpreting a gravestone doji candlestick after a rally, this pattern should never be ignored. Its story is one of balance, tension, and potential transformation.
If you’re serious about mastering candlestick analysis, understanding the doji candlestick pattern is non-negotiable.


