In the fast-paced world of technical analysis, few tools offer as much quiet confidence as the hidden bullish divergence. While flashy breakouts and big headlines steal the spotlight, this subtle but powerful signal works quietly in the background, alerting seasoned traders to trend continuations hiding in plain sight.
Whether you’re new to divergence trading or looking to refine your edge, understanding hidden bullish divergence could be the game-changer you didn’t know you needed.

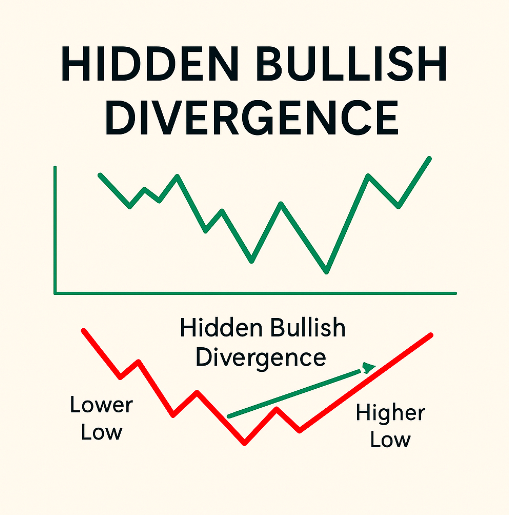
What Is a Hidden Bullish Divergence?
Hidden bullish divergence occurs when price makes a higher low, but the corresponding oscillator (like the RSI or MACD) makes a lower low. It’s a classic “trust the trend” moment — an indication that the existing bullish trend is likely to continue, even if price action momentarily stumbles.
Unlike regular bullish divergence, which often signals reversals from downtrends, hidden bullish divergence is all about confirmation — validating that the uptrend still has strength beneath the surface. This divergence is best understood when paired with tools like the Relative Strength Index (RSI), volume data, or trendlines.
Why Hidden Bullish Divergence Matters in Divergence Trading
Divergence trading isn’t just about catching reversals. It’s about reading market momentum and identifying when price and indicator are out of sync. In the context of bullish RSI divergence, most traders hunt for obvious reversal signs. But hidden divergence shifts your focus from what’s changing to what’s continuing.
This is crucial in markets that move in waves. You’ll often find triple tap divergences — where price tests a support level multiple times — acting as breeding grounds for hidden divergence. They whisper strength just as others are screaming weakness.
Imagine this: A crypto asset like Bitcoin drops slightly after a rally, RSI dives even lower, and everyone panics. But a hidden bullish divergence trader sees the higher low in price and lower low in RSI as a hidden signal that momentum remains strong. Two days later, price surges again — and you’re already in the trade.
Spotting Hidden Bullish Divergence on RSI
The RSI (Relative Strength Index) is one of the most effective tools to catch hidden bullish divergence. Here’s how:
- Price Action: Higher low
- RSI Movement: Lower low
- Trend Direction: Uptrend
When this setup occurs, it’s your cue that buyers are still in control, even if the pullback seems bearish at first glance.
Real-Life Example:
Take Apple (AAPL) in late 2022. The stock was in a steady uptrend, then pulled back modestly. Price formed a higher low, but RSI dipped lower than its previous trough. Smart traders spotted the hidden divergence and bought in before the stock resumed its uptrend — and gained over 15% in a matter of weeks.
Volume Divergence: An Overlooked Companion
Want to give your hidden divergence trades even more power? Pair them with volume divergence.
What is volume divergence in trading? It’s when volume trends contradict price movement. For example, if price pulls back on declining volume, it reinforces the idea that selling pressure is weak — adding weight to your hidden bullish divergence setup.
Pro Tip: Look for price making a higher low, with RSI showing a lower low and volume falling — that’s a trifecta of quiet confirmation.
Hidden Bullish vs. Hidden Bearish Divergence: Two Sides of the Same Coin
While hidden bullish divergence signals a continuation in uptrend, hidden bearish divergence does the opposite — it hints that a downtrend is likely to persist.
Comparison Table:
| Divergence Type | Price Movement | Indicator Movement | Signal |
|---|---|---|---|
| Hidden Bullish Divergence | Higher Low | Lower Low | Trend continuation (bullish) |
| Hidden Bearish Divergence | Lower High | Higher High | Trend continuation (bearish) |
This contrast helps you stay on the right side of momentum, whether the market is climbing or correcting.
Common Mistakes When Trading Hidden Bullish Divergence
Even experienced traders can get trapped. Here are some classic errors to avoid:
- Trading Against the Trend: Hidden divergence works best with the trend, not against it.
- Ignoring Market Context: Don’t rely on divergence in isolation. Confirm with trendlines, support zones, or triple tap divergence patterns.
- Overtrading Signals: Not every divergence deserves a trade. Filter setups with confluence and patience.
Expert Insights: What Pros Say About Hidden Divergences
“Divergence is not just about catching tops and bottoms. Hidden divergence, in particular, is like reading between the lines of a price chart — it gives away the story before others see the ending.”
— Linda Raschke, Professional Trader & Author
“When price hesitates but momentum deepens, that’s a subtle yet powerful cue. Hidden bullish divergence is a cornerstone of my trend continuation setups.”
— Adam Grimes, Market Technician & Educator
Future Outlook: Will Hidden Bullish Divergence Stay Relevant?
With the rise of algorithmic trading and machine learning models, some traders wonder whether these traditional signals still hold weight. The answer is yes — and here’s why:
- Human Psychology Remains Constant: Divergences reflect crowd behavior, which hasn’t changed.
- Algorithms Often Use Similar Signals: Many institutional models are coded to detect and act on divergences — sometimes amplifying the moves.
- Volatility Breeds Opportunity: In increasingly volatile markets (like crypto), divergence signals become even more critical.
Conclusion: Hidden Bullish Divergence Is Your Edge in a Noisy Market
In a world full of overbought/oversold alarms and price action hype, hidden bullish divergence is the calm voice of logic. It tells you, “The trend isn’t over yet.” For traders who can listen — and act — it can be the difference between catching a wave early and missing the entire move.
So next time RSI dips lower while price stays resilient, take a second look. You might just uncover the market’s best-kept secret.
Hidden Bullish Divergence: The Takeaway
To recap, here’s what makes hidden bullish divergence so valuable:
- It confirms uptrends quietly, before momentum returns.
- It works seamlessly with tools like bullish RSI divergence, volume divergence, and triple tap divergence.
- It filters out false reversals, keeping you aligned with trend strength.
- It’s used by pros and remains relevant even in algorithmic environments.
Master it — and you’ll start seeing moves others completely miss.


Leave a Reply