When it comes to futures trading, precision is everything. And for traders focused on the Dow Jones futures market (YM), understanding how to use the MACD—Moving Average Convergence Divergence—can be the difference between sharp entries and frustrating misses. This blog dives deep into MACD for YM, exploring actionable strategies, setups, and real-world tips to help you leverage this powerful momentum indicator with clarity and confidence.
Whether you’re new to the MACD or have been trading it for years, applying it specifically to Dow Jones futures (YM) requires nuance, adaptability, and a blend of technical insight and trader intuition.
What Is MACD for YM?
Before we get tactical, let’s get clear. MACD for YM refers to using the Moving Average Convergence Divergence indicator specifically when trading Dow Jones Mini Futures (YM). It’s one of the most reliable momentum-based indicators in technical analysis and is especially effective when trading volatile instruments like futures contracts.
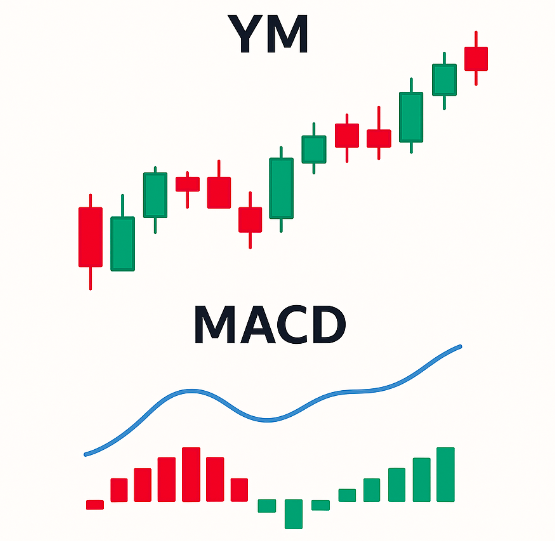
The MACD works by comparing two moving averages of price—typically the 12-period EMA and the 26-period EMA—then plotting a histogram to track the difference (or convergence/divergence) between them. The result? A clearer sense of trend momentum, potential reversal points, and tradeable divergence signals.
Understanding MACD stock meaning, MACD divergence, and even the MACD formula lays a foundation, but applying that to YM—where timing and volatility are key—adds a whole new dimension.
How to Read MACD for YM with Confidence
To trade the MACD for YM like a pro, you must master how to read its signals in the context of futures price behavior. Here’s a breakdown:
Signal Line Crossovers
The MACD line crossing above the signal line is traditionally seen as a bullish signal; when it crosses below, it’s bearish. For YM traders, this can hint at intraday momentum shifts or early signs of trend continuation.
Pro Tip: On 5- or 15-minute charts during the New York session, a crossover on the MACD combined with a breakout of previous session highs/lows often signals a high-probability scalp.
Histogram Strength
The MACD histogram helps gauge momentum strength. If bars are growing in height above the zero line, bulls are in control. Shrinking bars may indicate a fading move or potential divergence—a key cue for Dow Jones futures traders where momentum shifts can happen fast.
Divergence Signals in MACD
A classic MACD divergence—when price makes a new high/low but the MACD does not—can flag reversals. In YM, divergence on a 1-hour chart during lunchtime lull periods can signal powerful snapbacks before the power hour kicks in.
Best MACD Trading Strategy for Dow Jones Futures (YM)
Let’s zoom in on a MACD trading strategy tailored to YM:
The Pre-Market Fade + MACD Confirmation Setup
This strategy looks for a pre-market rally or dip that extends into the open, followed by an MACD signal line crossover that confirms momentum shift.
Steps:
- Identify overextended price action pre-market.
- Watch for MACD crossover on the 1-minute or 5-minute chart post-open.
- Enter trade once price breaks minor support/resistance with MACD confirmation.
- Use prior session VWAP or intraday EMA as targets.
This pattern repeats often in YM and has a strong success rate when used in conjunction with volume spikes.
Example: On March 21st, 2024, YM opened strong but faded quickly. The MACD crossover on the 5-minute chart confirmed a clean short for 80+ ticks.
MACD for YM vs. MACD for NQ or ES: What’s Different?
While MACD mechanics are universal, its application differs depending on the index you’re trading.
- YM (Dow Jones Futures): More responsive to blue-chip news and heavy institutional rotations. MACD reacts to macro catalysts.
- NQ (Nasdaq Futures): Volatile, tech-heavy, more prone to false MACD signals due to rapid whipsaws.
- ES (S&P Futures): Balanced. MACD works well for trend-following on higher timeframes.
If you’re using MACD for NQ, expect more head-fakes. With YM, slower but more reliable follow-through on confirmed signals is often the case.
MACD Settings and Platforms for YM Traders
Many YM traders use Thinkorswim MACD or TradingView. Here are optimal settings:
- Fast Length: 12
- Slow Length: 26
- Signal Smoothing: 9
These are default MACD settings and work well on both lower (1-15 min) and higher (1-4 hour) timeframes.
For more aggressive setups, consider tweaking the MACD formula to a 6/19/3 configuration to make it more sensitive—especially helpful for scalpers.
Real-World Example: Using MACD to Trade Dow Futures Like a Fund
Let’s borrow a page from how institutional desks approach MACD for YM:
- Funds like BCAT (BlackRock Capital Allocation Trust) monitor macroeconomic reports like NFP or CPI, then layer in MACD signals post-news for cleaner entries.
- When YM pulls back to the 20 EMA and MACD confirms momentum return, large blocks enter with tight risk.
While retail traders don’t have that scale, using MACD the same way—with institutional structure—can level up your results.
Common Mistakes When Using MACD for YM
Even seasoned traders make mistakes with MACD:
- Trading every crossover: Not every signal is trade-worthy. Combine MACD with support/resistance.
- Ignoring divergence: Spotting hidden divergence can give early entries. Learn it well.
- Overcomplicating things: Sometimes the basic MACD signal on clean structure is all you need.
Final Thoughts: Is MACD for YM Still Relevant in 2025?
Absolutely. In a world of AI-driven algos and high-frequency noise, the MACD for YM remains a clean, effective way to track momentum and trend shifts—especially when paired with price action and structure.
Used correctly, it’s like having a compass in the storm.
“Indicators like MACD don’t predict, but they clarify. It’s the trader’s job to interpret that clarity in real-time.” — James Dalton, market profile expert
Related Reading
- RSI Divergence: Spot Bullish & Bearish Trends With The RSI Indicator
- Bullish Divergence: RSI, MACD & Trend Reversal Signals
- Doji Candlestick Pattern: What is it, Analysis, Strategy & Examples
If you’re serious about leveling up your futures game, start practicing MACD for YM across different sessions. Whether you’re scalping the open or catching reversals mid-day, this indicator—when read in context—can anchor your entire strategy.
Ready to put the MACD to work?


Leave a Reply